Showing posts with label Active Adult Community. Show all posts

Monday, August 17, 2020

JUST LISTED IN SCCL

This beautiful Copper Ridge is centrally located in the Grey Hawk neighborhood of Sun City Carolina Lakes. Original owner has put lots of extras into this home! Lovely great room boasts recessed lighting and fireplace that was converted to provide heat, as well as ambiance, on a chilly day. Master bedroom has tray ceiling, custom ceiling lighting, and bath with double sinks, garden tub, separate shower, and a large walk-in closet. Plantation shutters throughout. Hardwood floors in Great Room, MBR, and Office/Den. Kitchen has SS appliances, granite counters, solar tube, recessed lighting, pull-out shelves, under cabinet lighting, and is wired for above cabinet lighting. MBR, BR 2 and Great Room are all wired for wall-mount TVs. Enjoy the lovely rear yard from the patio with covered lanai and charming screened porch with solar shades. Come and live the amazing SCCL lifestyle – enjoy all the beautiful amenities and diverse activities this premier active adult - hiking trails, indoor pool, 2 outdoor pools, state-of-the-art fitness center, pottery studio, community gardens, tennis, pickleball, bocce, softball, canoe & kayak center, woodworkers shop, dog park, golf course, and much more!

Wednesday, February 19, 2020

The Many Benefits of Aging in a Community

Article Courtesy of Keeping Current Matters/The KCM Blog

There’s comfort in being around people who share common interests, goals, and challenges. That comfort in a community doesn’t wane with age – it actually deepens. Whether it’s proudly talking about grandchildren or lamenting the fact that our eyes aren’t as good as they used to be, it helps to be around people who not only understand what we’re saying but actually feel the same joys and concerns as well.


That’s why many boomers are deciding to move into an active adult community. In the latest 55places National Housing Survey, they were described by one out of three seniors as an “outgoing, social community of likeminded people.” 
Bill Ness, Chief Executive Officer and Founder of 55places.com, explains:

“Baby boomers are now reaching the age when moving to an active adult community is the ideal opportunity for them…Many boomers now want to downsize, experience a maintenance-free lifestyle, and pursue more social opportunities. It’s exciting that there are so many choices for baby boomers.”
There’s still a desire, however, among many seniors to “age-in-place.” According to the Senior Resource Guide, aging-in-place means:

“…that you will be remaining in your own home for the later years of your life; not moving into a smaller home, assisted living, or a retirement community etcetera.”
The challenge is, many seniors live in suburban or rural areas, and that often necessitates driving significant distances to see friends or attend other social engagements. A recent report from the Joint Center for Housing Studies of Harvard University (JCHS) titled Housing America’s Older Adults addressed this exact concern:

“The growing concentration of older households in outlying communities presents major challenges for residents and service providers alike. Single-family homes make up most of the housing stock in low-density areas, and residents typically need to be able to drive to do errands, see doctors, and socialize.”
The Kiplinger report also chimed in on this subject:

“While most seniors say they want to age in place, a much smaller percentage of them actually manage to accomplish it, studies show. Transportation is often a problem; when you can no longer drive, you can’t get to medical appointments or to other outings.”
Driving may not be a challenge right now, but think about what it may be like to drive 10, 20, or 30 years down the road.
There are also health challenges brought on by a possible lack of socialization when living at home versus a community of seniors. Sarah J. Stevenson is an author who writes about seniors. In a recent blog post for A Place for Mom, she explains:

“Social contacts tend to decrease as we age for reasons such as retirement, the death of friends and family, or lack of mobility.”
Thankfully, research from the same article suggests if you’re spending time with others in a community, thus reducing the impact of loneliness and isolation, there’s less of a risk of developing high blood pressure, obesity, heart disease, a weakened immune system, depression, anxiety, cognitive decline, Alzheimer’s disease, and early death.
Though the familiarity of our current home may bring a feeling of warmth, comfort, and convenience, it’s important to understand that staying there may mean missing out on crucial socialization opportunities. Living with adult children, joining a retirement community, or moving to an assisted living facility can help us continue to be with people we enjoy every day.

Bottom Line

“Aging-in-place” definitely has its advantages, but it could mean getting “stuck-in-place” too. There are many health benefits derived from socialization with a community of people that shares common interests. It’s important to take the need for human interaction into consideration when making a decision about where to spend the later years in life.

Thursday, July 26, 2018

4 Reasons Why We Are Not Heading Toward Another Housing Bubble

4 Reasons Why We Are Not Heading Toward Another Housing Bubble 
Article Courtesy of Keeping Current Matters/The KCM Blog


With home prices continuing to appreciate above historic levels, some are concerned that we may be heading for another housing ‘boom & bust.’ It is important to remember, however, that today’s market is quite different than the bubble market of twelve years ago.
Here are four key metrics that will explain why:

    1. Home Prices
    2. Mortgage Standards
    3. Foreclosure Rates
    4. Housing Affordability

1. HOME PRICES

There is no doubt that home prices have reached 2006 levels in many markets across the country. However, after more than a decade, home prices should be much higher based on inflation alone.
Last week, CoreLogic reported that,

“The inflation-adjusted U.S. median sale price in June 2006 was $247,110 (or $199,899 in 2006 dollars), compared with $213,400 in March 2018.” (This is the latest data available.)

2. MORTGAGE STANDARDS

Many are concerned that lending institutions are again easing standards to a level that helped create the last housing bubble. However, there is proof that today’s standards are nowhere near as lenient as they were leading up to the crash.
The Urban Institute’s Housing Finance Policy Center issues a monthly index which,

“…measures the percentage of home purchase loans that are likely to default—that is, go unpaid for more than 90 days past their due date. A lower HCAI indicates that lenders are unwilling to tolerate defaults and are imposing tighter lending standards, making it harder to get a loan. A higher HCAI indicates that lenders are willing to tolerate defaults and are taking more risks, making it easier to get a loan.”
Their July Housing Credit Availability Index revealed:

“Significant space remains to safely expand the credit box. If the current default risk was doubled across all channels, risk would still be well within the pre-crisis standard of 12.5 percent from 2001 to 2003 for the whole mortgage market.”

3. FORECLOSURE RATES

A major cause of the housing crash last decade was the number of foreclosures that hit the market. They not only increased the supply of homes for sale but were also being sold at 20-50% discounts. Foreclosures helped drive down all home values.
Today, foreclosure numbers are lower than they were before the housing boom. Here are the number of consumers with new foreclosures according to the Federal Reserve’s most recent Household Debt and Credit Report:

  • 2003: 203,320 (earliest reported numbers)
  • 2009: 566,180 (at the valley of the crash)
  • Today: 76,480
Foreclosures today are less than 40% of what they were in 2003.

4. HOUSING AFFORDABILITY

Contrary to many headlines, home affordability is better now than it was prior to the last housing boom. In the same article referenced in #1, CoreLogic revealed that in the vast majority of markets, “the inflation-adjusted, principal-and-interest mortgage payments that homebuyers have committed to this year remain much lower than their pre-crisis peaks.”
They went on to explain:

“The main reason the typical mortgage payment remains well below record levels in most of the country is that the average mortgage rate back in June 2006, when the U.S. typical mortgage payment peaked, was about 6.7 percent, compared with an average mortgage rate of about 4.4 percent in March 2018.”
The “price” of a home may be higher, but the “cost” is still below historic norms.

Bottom Line

After using these four key housing metrics to compare today to last decade, we can see that the current market is not anything like that bubble market.

Thursday, July 12, 2018

House-Buying Power at Near-Historic Levels

Article Courtesy of Keeping Current Matters/The KCM Blog

House-Buying Power at Near-Historic Levels | Keeping Current Matters
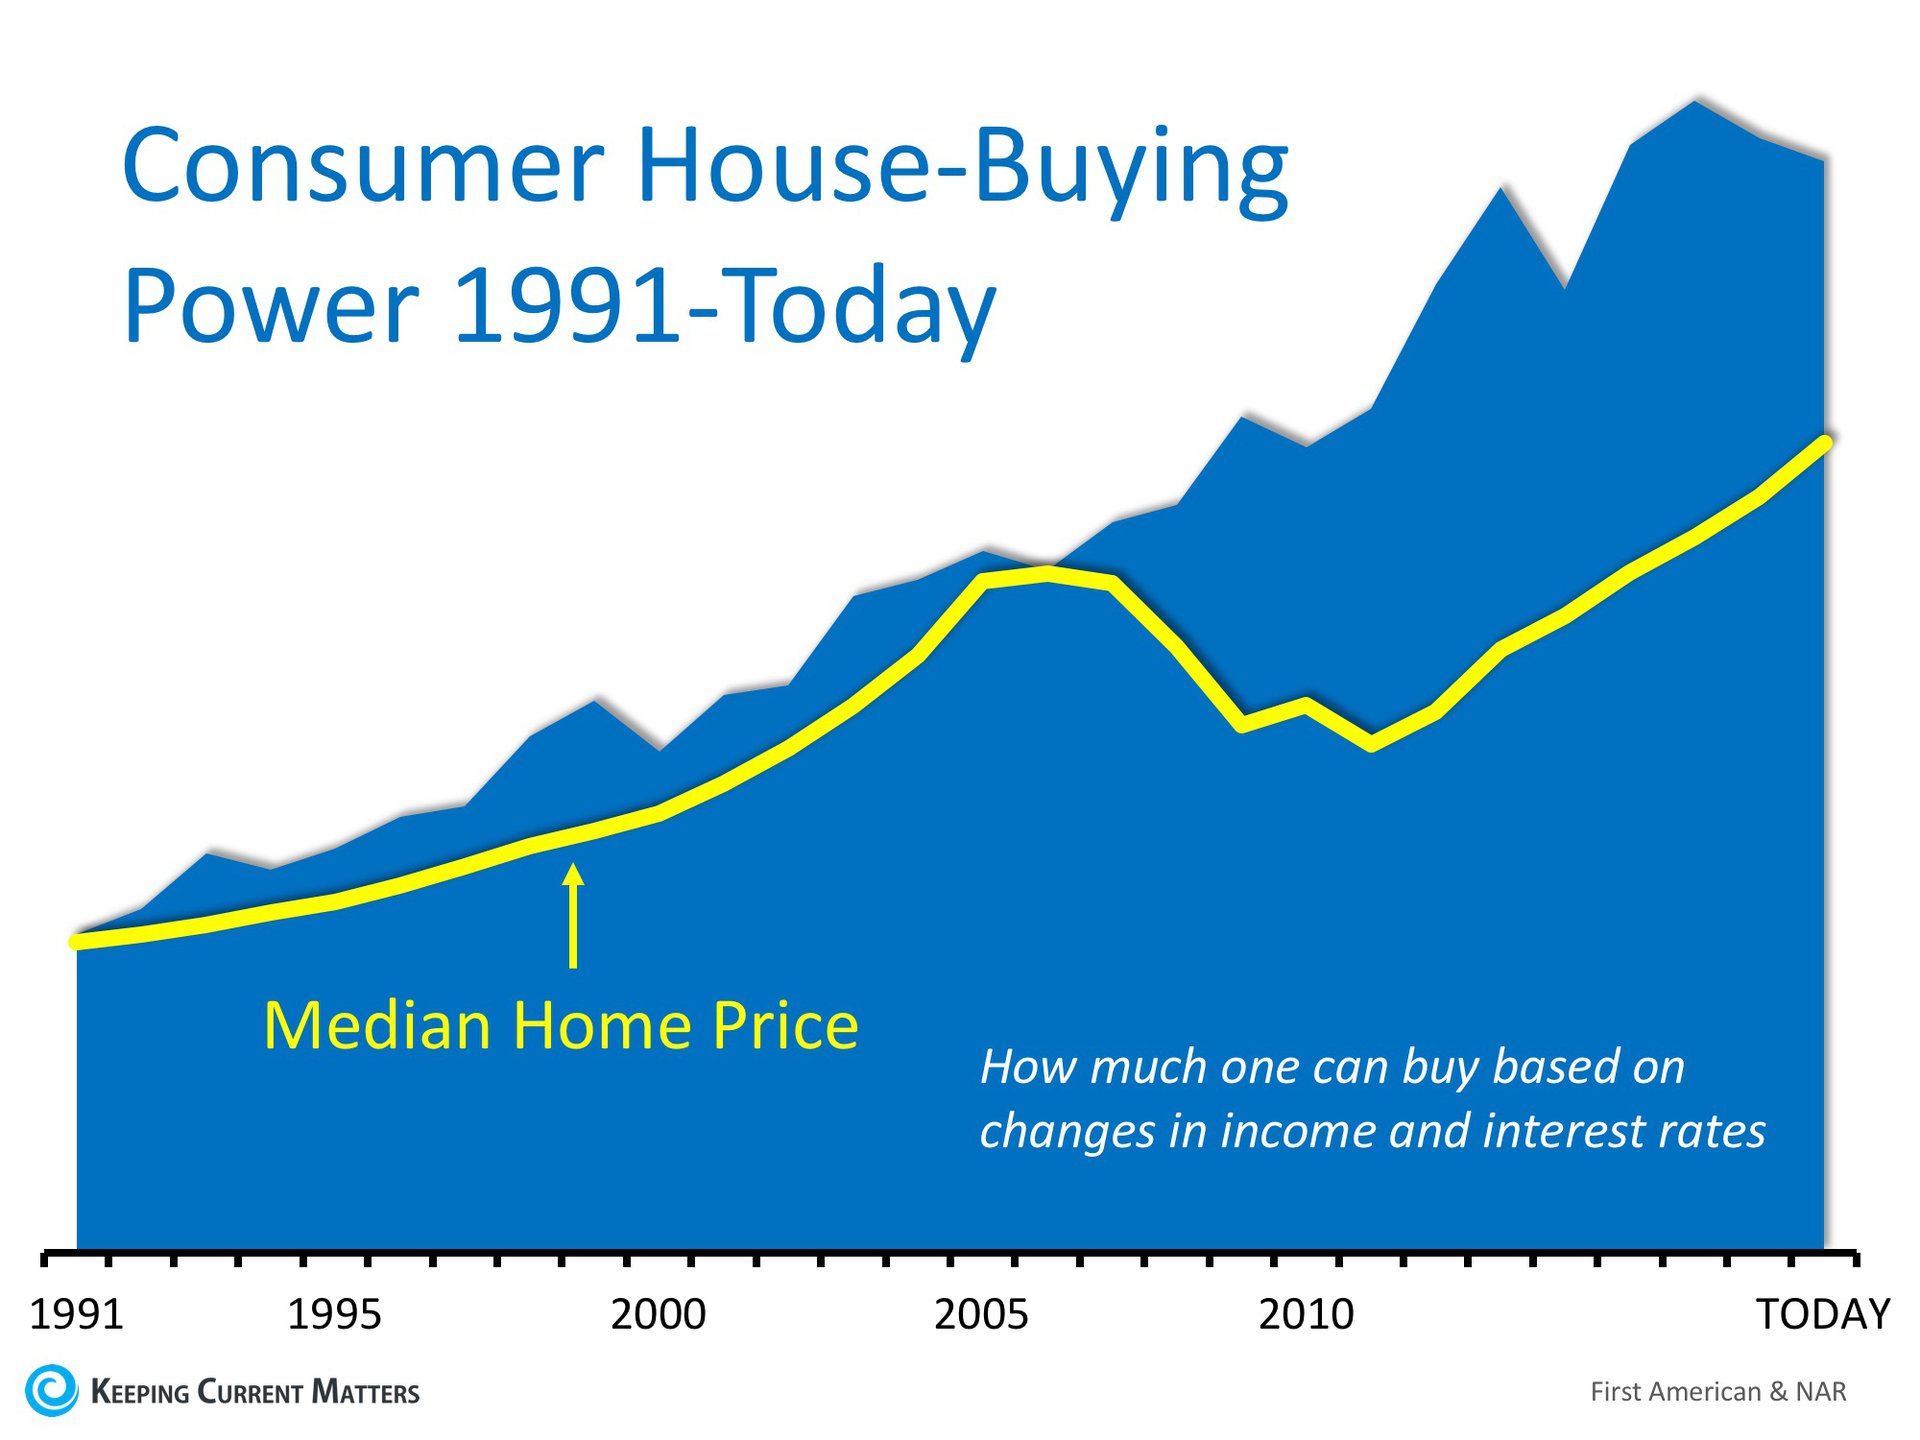
We keep hearing that home affordability is approaching crisis levels. While this may be true in a few metros across the country, housing affordability is not a challenge in the clear majority of the country. In their most recent Real House Price Index, First American reported that consumer “house-buying power” is at “near-historic levels.”
Their index is based on three components:

  1. Median Household Income
  2. Mortgage Interest Rates
  3. Home Prices
The report explains:

“Changing incomes and interest rates either increase or decrease consumer house-buying power or affordability. When incomes rise and/or mortgage rates fall, consumer house-buying power increases.”
Combining these three crucial pieces of the home purchasing process, First American created an index delineating the actual home-buying power that consumers have had dating back to 1991.
Here is a graph comparing First American’s consumer house-buying power (blue area) to the actual median home price that year from the National Association of Realtors (yellow line).
House-Buying Power at Near-Historic Levels | Keeping Current Matters

Consumer house-buyer power has been greater than the actual price of a home since 1991. And, the spread is larger over the last decade.

Bottom Line

Even though home prices are increasing rapidly and are now close to the values last seen a decade ago, the actual affordability of a home is much better now. As Chief Economist Mark Fleming explains in the report:

“Though unadjusted house prices have risen to record highs, consumer house-buying power stands at near-historic levels, as well, signaling that real house prices are not even close to their historical peak.”

Friday, July 6, 2018

Cost Across Time

Infographic courtesy of Keeping Current Matters/The KCM Blog

Looking back in time gives us the opportunity to really appreciate the value of today's interest rates.  While rates have started going up, today's rates remain significantly lower than in previous decades and buying power remains strong. 


Some Highlights:


  • With interest rates still around 4.5%, now is a great time to look back at where rates have been over the last 40 years.
  • Rates are projected to climb to 5.1% by this time next year according to Freddie Mac.
  • The impact your interest rate makes on your monthly mortgage cost is significant!
  • Lock in a low rate now while you can!


Wednesday, July 4, 2018

VA LOANS: MAKING A HOME FOR THE BRAVE POSSIBLE

VA Loans: Making a Home for the Brave Possible
Article Courtesy of Keeping Current Matters/The KCM Blog


VA Loans: Making a Home for the Brave Possible | Keeping Current MattersSince the creation of the Veterans Affairs (VA) Home Loans Program, over 22 million veterans have achieved the American Dream of homeownership. Many veterans do not know the details of the program and therefore do not take advantage of the benefits available to them.
If you are a veteran or you know someone who is, here is a breakdown of the VA Home Loan benefits that can be used to achieve the American Dream!

Top 5 Benefits of a VA Home Loan


  1. The greatest benefit of a VA Loan is that borrowers can buy a home with a 0% down payment. In 2016, 82% of all VA Loans put down 0%!
  2. Primary Mortgage Insurance (PMI) is not required! (Most other loans with down payments under 20% require PMI, which adds additional costs to your monthly housing expense!)
  3. Credit Score requirements are also lower for VA Home Loans. The average FICO® score of a borrower for an approved VA Loan is 620, compared to 676 (FHA) or 753 (Conventional).
  4. There is also a limitation on a veteran buyer’s closing costs. Sellers can pay all of a buyer’s loan-related closing costs and up to 4% in concessions in some cases.
  5. Even with interest rates rising, VA Loans continue to have the lowest average interest rates of all loan types.

Who Qualifies for a VA Home Loan?

One of the most important first steps when applying for a VA Home Loan is obtaining your Certificate of Eligibility (COE). “The COE verifies to the lender that you are eligible for a VA-backed loan.”

You Can Apply for a VA Loan if You:


  • Serve 90 consecutive days during wartime
  • Serve 181 consecutive days during peacetime
  • Have more than 6 years in the National Guard or Reserves
  • Are the spouse of a service member who has died in the line of duty or as the result of a service-related disability

You Can Use a VA Loan To:


  • Purchase a Home
  • Purchase a Condo
  • Build a Home
  • Refinance an existing home loan
  • Make improvements to a home by installing energy-related features or making energy-efficient improvements

Bottom Line

For more information or to find out if you or a loved one would qualify to use the VA Home Loan Benefit, contact a local real estate professional who can help! Thank you for your service!

Tuesday, July 3, 2018

SCCL CURRENTLY ACTIVE LISTINGS

THE CHARTS BELOW ARE NOT INTERACTIVE.
TO VIEW ACTUAL LISTINGS,  USE THE FOLLOWING LINKS.

Click HERE for current single family home listings in SCCL.

Click HERE for current condo/townhouse listings in SCCL.


DOM = Days on Market
HLA = Heated Living Area (Square Footage)
Price/SF = Price Per Square Foot

Properties listed and sold by various CMLS participants.

SCCL CURRENTLY UNDER CONTRACT


DOM = Days on Market
HLA = Heated Living Area (Square Footage)
Price/SF = Price Per Square Foot
UC Date = Under Contract Date

Properties listed and sold by various CMLS participants.  

SCCL 2018 CLOSED LISTINGS

JANUARY / FEBRUARY /MARCH


APRIL / MAY / JUNE 


DOM = Days on Market
HLA = Heated Living Area (Square Footage)
Price/SF = Price Per Square Foot
UC Date = Under Contract Date

Properties listed and sold by various CMLS participants.