Sunday, September 2, 2018

Lots Near Power Lines Lose Nearly Half Their Value

Article Courtesy of REALTOR® MAGAZINE
August 22, 2018

 
Study: Lots Near Power Lines Lose Nearly Half Their Value


Lots located next to power lines tend to sell for a whopping 45 percent less than similar lots further away from high-voltage transmission lines, according to a new study in the Journal of Real Estate Research. Lots that are non-adjacent to power lines but are located within 1,000 feet of them often sell at a discount of 18 percent, researchers Chris Mothorpe and David Wyman, the authors of the study, found.


The study focused on the value of vacant land, eliminating other factors that could also influence price, such as home style and square footage. The researchers say land typically represents 20 percent of a home’s overall value. Therefore, the 45 percent decrease in land value would translate to a drop in total property value of around 9 percent, according to the study.


Mothorpe and Wyman, assistant professors at the College of Charleston in Charleston, S.C., culled sales data from 5,455 vacant lots sold between 2000 and 2016 in Pickens County, S.C. A network of high-voltage electrical lines are located in Pickens County from the Oconee Nuclear Station.


Mothorpe says health concerns about being near high-voltage lines are one of the factors likely driving down prices of nearby land. But a solid link between power lines and health issues remains elusive, he adds. Unattractive views of power lines also affects land prices, Mothorpe says, and residents who live near them may hear a humming sound produced by the lines. “My intuition tells me the visual [component] is the largest” factor leading to a decrease in values, Mothorpe told The Wall Street Journal.

Thursday, August 23, 2018

What Does the Recent Rash of Price Reductions Mean to the Real Estate Market?

Article Courtesy of Keeping Current Matters/The KCM Blog

What Does the Recent Rash of Price Reductions Mean to the Real Estate Market? | Keeping Current MattersLast week, in a new report from Zillow, it was revealed that there has been a rash of price reductions across the country. According to the report:
  • There are more price cuts now than a year ago in over two-thirds of the nation’s largest metros
  • About 14% of all listings had a price cut in June
  • Since the beginning of the year, the share of listings with a price cut increased 1.2%
  • This is the greatest January-to-June increase ever reported, and more than double the January-to-June increase last year
Senior Economist Aaron Terrazas further explained:
“A rising share of on-market listings are seeing price cuts, though these price cuts are concentrated at the most expensive price-points and primarily in markets that have seen outsized price gains in recent years.”

What this DOESN’T MEAN for the real estate market…

This doesn’t mean home values have depreciated or are about to depreciate.
A seller may put a home worth $300,000 on the market for $325,000 hoping a bidding war will occur and an overanxious buyer will pay more than its actual value. That has happened often over the last few years. If the seller gets no offers and reduces the price to $300,000, it doesn’t mean the home dropped in value. It is still worth $300,000.
Home prices will continue to appreciate over the next 12 months. In this same report, Terrazas remarks:
“It’s far too soon to call this a buyer’s market, home values are still expected to appreciate at double their historic rate over the next 12 months, but the frenetic pace of the housing market over the past few years is starting to return toward a more normal trend.”

What this DOES MEAN for the real estate market…

This does mean that sellers should be more conservative when it comes to the price at which they list their homes – especially sellers in the upper end of each market.
Sellers have been listing their homes at inflated prices hoping a super-hot market will deliver a buyer willing to pay virtually any price to ensure they don’t lose the house. That strategy has worked somewhat successfully over the last two years. However, the time that strategy would have worked may have passed.
Again, quoting Aaron Terrazas in the report:
“The housing market has tilted sharply in favor of sellers over the past two years, but there are very early preliminary signs that the winds may be starting to shift ever-so-slightly.”

Bottom Line

Prices are not depreciating. However, if you want to sell your house quickly and with the least amount of hassles, pricing it correctly from the beginning makes the most sense.

Tuesday, August 21, 2018

Golf Cart Information From Sheriff Faile

With the new shopping center opening across 521, increased traffic will likely become a safety issue for SCCL residents.  Sheriff Faile has written a letter to the Editor of Living@SCCL magazine with important information about golf cart safety.

To read Sheriff Faile's letter, click HERE.

Pook's Perception:  Even though you can, don't.  Golf carts and traffic are an unsafe mix!

5 Real Estate Realty TV Myths Explained

Article courtesy of Keeping Current Matters/The KCM Blog

5 Real Estate Reality TV Myths Explained | Keeping Current MattersHave you ever been flipping through the channels, only to find yourself glued to the couch in an HGTV binge session? We’ve all been there, watching entire seasons of “Love it or List it,” “Million Dollar Listing,” “House Hunters,” “Property Brothers,” and so many more all in one sitting.
When you’re in the middle of your real estate themed show marathon, you might start to think that everything you see on TV must be how it works in real life, but you may need a reality check.

Reality TV Show Myths vs. Real Life:

Myth #1: Buyers look at 3 homes and decide to purchase one of them.
Truth: There may be buyers who fall in love and buy the first home they see, but according to the National Association of Realtors the average homebuyer tours 10 homes as a part of their search.  

Myth #2: The houses the buyers are touring are still for sale.
Truth: Everything is staged for TV. Many of the homes being shown are already sold and are off the market. 

Myth #3: The buyers haven’t made a purchase decision yet.
Truth: Since there is no way to show the entire buying process in a 30-minute show, TV producers often choose buyers who are further along in the process and have already chosen a home to buy. 

Myth #4: If you list your home for sale, it will ALWAYS sell at the open house.
Truth: Of course, this would be great! Open houses are important to guarantee the most exposure to buyers in your area but are only a PIECE of the overall marketing of your home. Keep in mind that many homes are sold during regular listing appointments as well. 

Myth #5: Homeowners decide to sell their homes after a 5-minute conversation.
Truth: Similar to the buyers portrayed on the shows, many of the sellers have already spent hours deliberating the decision to list their homes and move on with their lives/goals.

Bottom Line

Having an experienced professional on your side while navigating the real estate market is the best way to guarantee that you can make the home of your dreams a reality!

Friday, August 17, 2018

The Cost of Waiting: Interest Rates Edition [INFOGRAPHIC]

Infographic Courtesy of Keeping Current Matters/The KCM Blog

The Cost of Waiting: Interest Rates Edition [INFOGRAPHIC] | Keeping Current Matters

Some Highlights:

  • Interest rates are projected to increase steadily heading into 2019.
  • The higher your interest rate, the more money you end up paying for your home and the higher your monthly payment will be.
  • Rates are still low right now – don’t wait until they hit 5% to start searching for your dream home!

Thursday, August 2, 2018

LASS ARTICLE - LIVING@SCCL / AUGUST 2018


As an animal lover and rescue dog mom, I proudly serve as a member of the Board of the Lancaster Animal Shelter Supporters.

I am delighted to share an article that I wrote for our community magazine, LIVING@SCCL.

For additional information about LASS, please visit the LASS website.   You, too, can help the animals of Lancaster County...


ADOPT • VOLUNTEER • DONATE • FOSTER

To view as a PDF, click HERE.

Thursday, July 26, 2018

4 Reasons Why We Are Not Heading Toward Another Housing Bubble

4 Reasons Why We Are Not Heading Toward Another Housing Bubble 
Article Courtesy of Keeping Current Matters/The KCM Blog


With home prices continuing to appreciate above historic levels, some are concerned that we may be heading for another housing ‘boom & bust.’ It is important to remember, however, that today’s market is quite different than the bubble market of twelve years ago.
Here are four key metrics that will explain why:

    1. Home Prices
    2. Mortgage Standards
    3. Foreclosure Rates
    4. Housing Affordability

1. HOME PRICES

There is no doubt that home prices have reached 2006 levels in many markets across the country. However, after more than a decade, home prices should be much higher based on inflation alone.
Last week, CoreLogic reported that,

“The inflation-adjusted U.S. median sale price in June 2006 was $247,110 (or $199,899 in 2006 dollars), compared with $213,400 in March 2018.” (This is the latest data available.)

2. MORTGAGE STANDARDS

Many are concerned that lending institutions are again easing standards to a level that helped create the last housing bubble. However, there is proof that today’s standards are nowhere near as lenient as they were leading up to the crash.
The Urban Institute’s Housing Finance Policy Center issues a monthly index which,

“…measures the percentage of home purchase loans that are likely to default—that is, go unpaid for more than 90 days past their due date. A lower HCAI indicates that lenders are unwilling to tolerate defaults and are imposing tighter lending standards, making it harder to get a loan. A higher HCAI indicates that lenders are willing to tolerate defaults and are taking more risks, making it easier to get a loan.”
Their July Housing Credit Availability Index revealed:

“Significant space remains to safely expand the credit box. If the current default risk was doubled across all channels, risk would still be well within the pre-crisis standard of 12.5 percent from 2001 to 2003 for the whole mortgage market.”

3. FORECLOSURE RATES

A major cause of the housing crash last decade was the number of foreclosures that hit the market. They not only increased the supply of homes for sale but were also being sold at 20-50% discounts. Foreclosures helped drive down all home values.
Today, foreclosure numbers are lower than they were before the housing boom. Here are the number of consumers with new foreclosures according to the Federal Reserve’s most recent Household Debt and Credit Report:

  • 2003: 203,320 (earliest reported numbers)
  • 2009: 566,180 (at the valley of the crash)
  • Today: 76,480
Foreclosures today are less than 40% of what they were in 2003.

4. HOUSING AFFORDABILITY

Contrary to many headlines, home affordability is better now than it was prior to the last housing boom. In the same article referenced in #1, CoreLogic revealed that in the vast majority of markets, “the inflation-adjusted, principal-and-interest mortgage payments that homebuyers have committed to this year remain much lower than their pre-crisis peaks.”
They went on to explain:

“The main reason the typical mortgage payment remains well below record levels in most of the country is that the average mortgage rate back in June 2006, when the U.S. typical mortgage payment peaked, was about 6.7 percent, compared with an average mortgage rate of about 4.4 percent in March 2018.”
The “price” of a home may be higher, but the “cost” is still below historic norms.

Bottom Line

After using these four key housing metrics to compare today to last decade, we can see that the current market is not anything like that bubble market.

Friday, July 20, 2018

What You Need to Know About the Mortgage Process

Whether you are purchasing your first home or are an experienced Buyer, it's vital to understand the Mortgage Process and to know what steps you need to take to start the process.  One important thing to remember throughout is not to sabotage your loan.  DO NOT make any large purchases (car, boat, furniture), apply for any other credit (new credit cards, car loan, home equity loan), or change your job status until after you have closed on your new home!  Know what you DO need to do and do it promptly, so you will be ready to move forward on the path toward home-ownership.

Infographic courtesy of Keeping Current Matters/The KCM Blog


Thursday, July 12, 2018

House-Buying Power at Near-Historic Levels

Article Courtesy of Keeping Current Matters/The KCM Blog

House-Buying Power at Near-Historic Levels | Keeping Current Matters
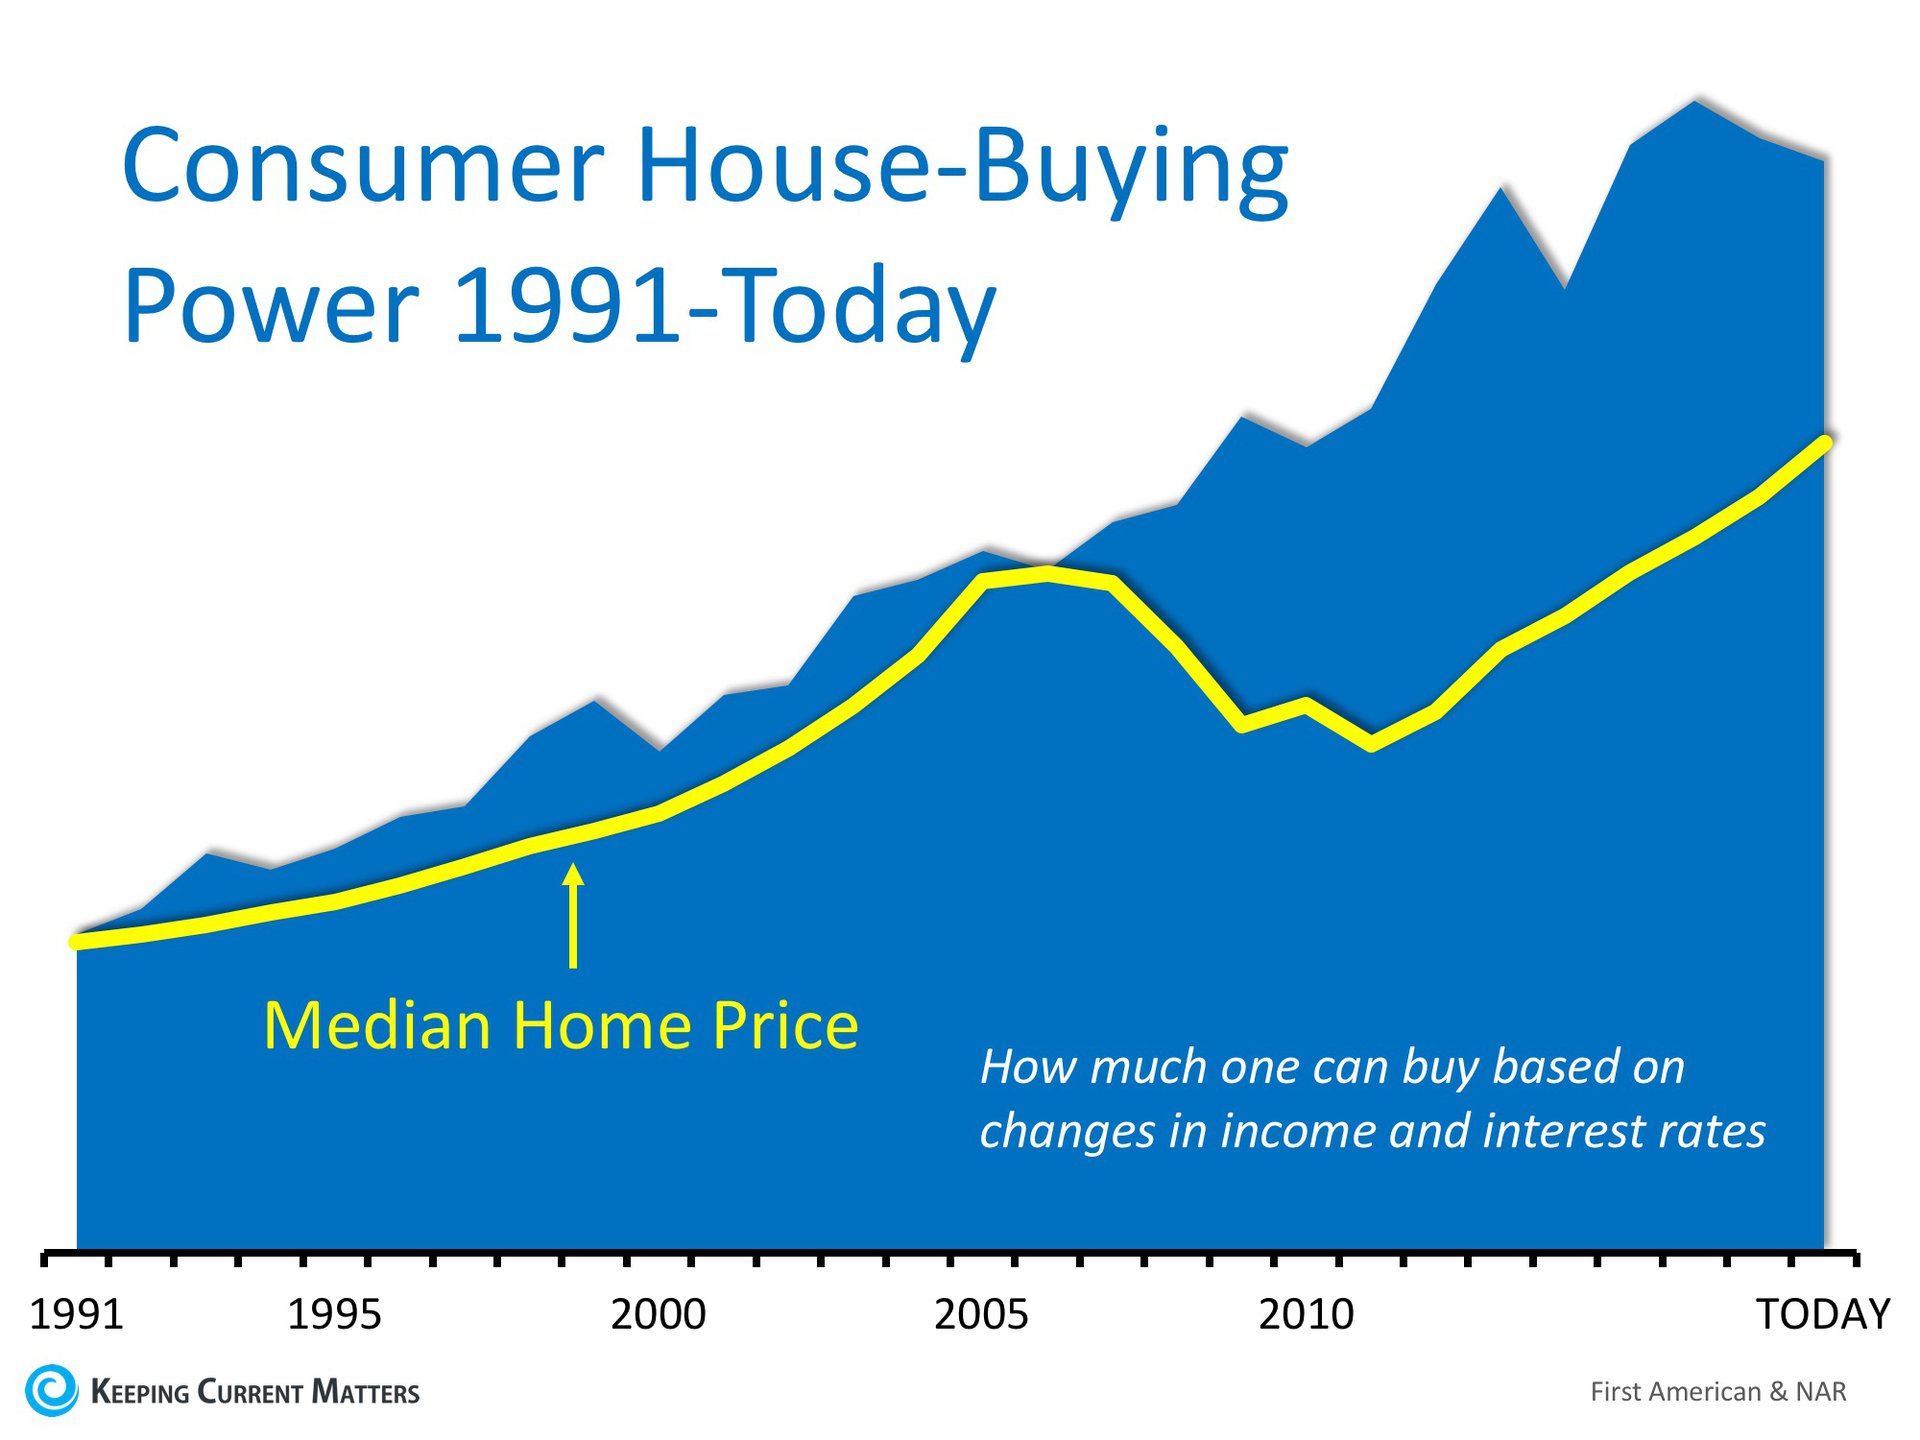
We keep hearing that home affordability is approaching crisis levels. While this may be true in a few metros across the country, housing affordability is not a challenge in the clear majority of the country. In their most recent Real House Price Index, First American reported that consumer “house-buying power” is at “near-historic levels.”
Their index is based on three components:

  1. Median Household Income
  2. Mortgage Interest Rates
  3. Home Prices
The report explains:

“Changing incomes and interest rates either increase or decrease consumer house-buying power or affordability. When incomes rise and/or mortgage rates fall, consumer house-buying power increases.”
Combining these three crucial pieces of the home purchasing process, First American created an index delineating the actual home-buying power that consumers have had dating back to 1991.
Here is a graph comparing First American’s consumer house-buying power (blue area) to the actual median home price that year from the National Association of Realtors (yellow line).
House-Buying Power at Near-Historic Levels | Keeping Current Matters

Consumer house-buyer power has been greater than the actual price of a home since 1991. And, the spread is larger over the last decade.

Bottom Line

Even though home prices are increasing rapidly and are now close to the values last seen a decade ago, the actual affordability of a home is much better now. As Chief Economist Mark Fleming explains in the report:

“Though unadjusted house prices have risen to record highs, consumer house-buying power stands at near-historic levels, as well, signaling that real house prices are not even close to their historical peak.”

Friday, July 6, 2018

Cost Across Time

Infographic courtesy of Keeping Current Matters/The KCM Blog

Looking back in time gives us the opportunity to really appreciate the value of today's interest rates.  While rates have started going up, today's rates remain significantly lower than in previous decades and buying power remains strong. 


Some Highlights:


  • With interest rates still around 4.5%, now is a great time to look back at where rates have been over the last 40 years.
  • Rates are projected to climb to 5.1% by this time next year according to Freddie Mac.
  • The impact your interest rate makes on your monthly mortgage cost is significant!
  • Lock in a low rate now while you can!